Why this website is lightweight and simple.
This website is intentionally lightweight and simple. Not just for the sake of a pared-back appearance, but to reduce, wherever possible, the data needed to deliver information, the work required of your device, and the load placed on servers.
このウェブサイトは、意図的に軽量でシンプルにつくられています。単に、見た目を簡素にしたいからではありません。情報を届けるために必要なデータ転送や端末の処理、サーバーへの負担を、できる範囲で小さくするためです。
The web is physical.
The internet can feel as though it exists somewhere beyond the physical world. In reality, it relies on data centers, communications networks, smartphones, computers, and other tangible infrastructure. Running that infrastructure requires electricity. Building the equipment and devices behind it requires energy and resources, too.
インターネットは、目に見えない場所に存在しているように思えるかもしれません。しかし実際には、データセンター、通信ネットワーク、スマートフォンやパソコンといった物理的な設備によって支えられています。それらを動かすためには電力が必要で、設備や端末の製造にも資源とエネルギーが使われています。
According to the International Energy Agency, data centers worldwide used approximately 485 TWh of electricity in 2025. By 2030, that number is projected to reach around 950 TWh. One personal website will not change the direction of that growth. Still, I believe there is value in choosing not to rely on a larger system than necessary.
国際エネルギー機関によれば、世界のデータセンターによる電力消費は、2025年に約485TWh。2030年には約950TWhに達すると予測されています。個人のウェブサイトひとつが、この増加を左右するわけではありません。それでも、必要以上に大きな仕組みを使わないという判断には意味があると考えています。[1]
64.3KB.
- This website
- 64.3KB
- Typical homepage
- 2,559KB
- Page weight
- −97.5%
The public files needed to load this homepage add up to approximately 64.3 KB. In 2025, the median mobile homepage weighed around 2,559 KB. That is roughly 40 times larger. Based on a simple comparison of file sizes, the Rikuma Works homepage is about 97.5% lighter.
このサイトのトップページを表示するために必要な公開ファイルの合計は、約64.3KB。一方、2025年に調査された一般的なモバイル向けトップページの中央値は、約2,559KB。およそ40倍の差があります。公開ファイルの容量をもとに単純比較すると、Rikuma Worksのトップページは約97.5%小さいということになる。[2]
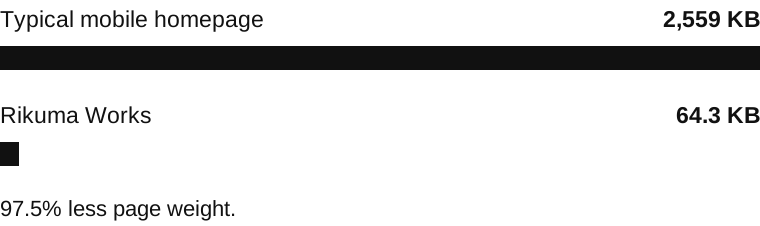
The difference comes to roughly 2.5 MB on a first visit. Across 1,000 first visits under the same conditions, that amounts to around 2.5 GB in file size.
一般的なページとの差は、初回表示あたり約2.5MB。同じ条件で1,000回表示されたと仮定すると、ファイル容量ベースで約2.5GBの差が生まれます。
These figures are estimates based on the combined size of publicly available files. Actual data transfer may differ once compression and caching are taken into account. The comparison also uses a median across many kinds of websites, not just personal websites with a similar purpose. A page that is 97.5% smaller does not necessarily produce 97.5% fewer emissions.
ただし、この数値は公開ファイルの合計容量にもとづく概算です。圧縮やキャッシュを考慮した実際の通信量とは異なります。比較対象も、同じ目的を持つ個人サイトだけではなく、さまざまなウェブサイトを含む全体の中央値。ページ容量が97.5%小さいことは、CO₂排出量も同じ割合で削減されるという意味ではありません。
What is included, and what is not.
The website is built around static HTML and a minimal amount of CSS. Its homepage loads five files: HTML, CSS, a JavaScript file, the logo, and a photograph. The JavaScript file is just 61 bytes and contains no executable code. There are no external web fonts, advertising services, analytics tools, or tracking scripts.
このサイトは、静的なHTMLと最小限のCSSを中心につくられています。トップページで読み込むのは、HTML、CSS、JavaScriptファイル、ロゴ、写真の5点。JavaScriptファイルは61バイトで、実行処理は含まれていません。外部のウェブフォントや広告、アクセス解析、トラッキング用のスクリプトも読み込みません。
A typical mobile homepage loads around 632 KB of JavaScript and another 122 KB of web fonts. But communicating what matters does not always require those extras. Photographs still have a place here. Not as decoration for its own sake, but as what is needed, at the size it needs to be.
一般的なモバイル向けトップページでは、JavaScriptだけで約632KB、ウェブフォントだけで約122KBが読み込まれています。しかし、必要な情報を伝えるために、それらが必ずしも必要とは限りません。写真は使用します。ただし、演出や装飾を増やすためではなく、必要なものを、必要なサイズで。[2]
A carbon estimate, not a promise.
A website's environmental impact can also be estimated in terms of carbon emissions. Version 4 of the Sustainable Web Design Model is an openly available framework that estimates emissions across data centers, communications networks, and user devices, including both operational and embodied impacts.
ウェブサイトの環境負荷は、CO₂換算で推計することもできます。Sustainable Web Design Model version 4は、データセンター、通信ネットワーク、利用者の端末について、運用時と製造時の負荷を含めて排出量を概算する公開モデルです。[3]
- Rikuma Works
- 0.0095 g CO₂e
- Typical mobile homepage
- 0.379 g CO₂e
- Estimated difference
- 0.370 g CO₂e
Using the model's published values and its global-average reference, this homepage accounts for approximately 0.0095 g CO₂e on a first visit. A typical mobile homepage comes to around 0.379 g CO₂e. That is a modeled difference of roughly 0.370 g CO₂e per visit, or about 370 g CO₂e across 1,000 first visits.
このモデルの公開値と世界平均の参考値を使用した場合、トップページの排出量は、初回表示あたり約0.0095g CO₂e。一般的なモバイル向けトップページは約0.379g CO₂e。その差は約0.370g CO₂eで、1,000回の初回表示を仮定すると、約370g CO₂eの差になる計算です。
The calculation uses an allocation factor equivalent to approximately 0.300 kWh per gigabyte of data and the model's global-average reference of 494 g CO₂e per kWh. It does not account for renewable-energy procurement or caching on return visits.
計算には、データ量1GBあたり約0.300kWh相当の配分係数と、このモデルが採用している世界平均の参考値、1kWhあたり494g CO₂eを用いています。再生可能エネルギーの調達や、再訪時のキャッシュは考慮していません。
These are not direct measurements of electricity use or actual emissions. Communications networks consume some electricity regardless of how much data passes through them, and peer-reviewed research shows that network energy use is not simply proportional to data volume. The figures here are not a claim of proven emissions savings. They are a way to compare different design choices while making the assumptions behind that comparison clear.
もちろん、これは実際の電力や排出量を直接測定した値ではありません。通信設備の消費電力には、データ量にかかわらず発生する部分があります。査読研究でも、通信データ量とネットワークの消費電力が単純な比例関係にないことが示されています。ここで示しているのは削減量の断定ではなく、前提条件を明示したうえで、設計の違いを比較するための参考値です。[4]
Keep existing devices useful.
The environmental impact of digital technology goes beyond the data and electricity used when a page loads. According to Arcep, France's telecommunications regulator, devices such as smartphones and computers account for around 50% of the country's digital carbon footprint. Most of those emissions arise during manufacturing, not while the devices are in use.
デジタルの環境負荷は、ページを開いた瞬間の通信や電力だけではありません。フランスの通信規制当局Arcepによれば、同国におけるデジタル分野全体のカーボンフットプリントの約50%を、スマートフォンやパソコンなどの端末が占めています。その排出の大部分は、使用時ではなく製造段階で生じています。[5]
Peer-reviewed research on smartphones found that, under one set of assumptions, around 78% of their carbon footprint came from materials and manufacturing. Extending the replacement cycle from two years to three reduced estimated lifecycle emissions by roughly 30%. Extending it to four years reduced them by around 44%.
スマートフォンを対象とした査読研究でも、ある条件下では、カーボンフットプリントの約78%が素材の調達や製造工程に由来していました。買い替え周期を2年から3年に延ばすと約30%、4年に延ばすと約44%。ライフサイクル全体で、それだけ排出量が小さくなるという推計です。[6]
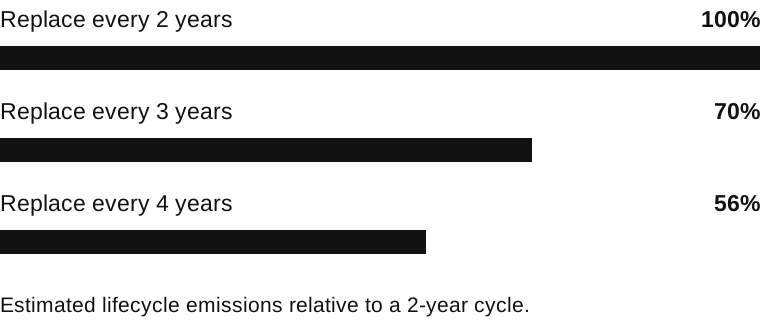
A lighter website, on its own, cannot be proven to prevent someone from replacing a device. But a website that remains usable on older hardware and limited connections can still help make it easier to keep using what already exists.
ひとつのウェブサイトを軽くしただけで、端末の買い替えが減ることまでは証明できません。それでも、古い端末や限られた通信環境でも閲覧しやすいサイトをつくることは、すでに存在する機器を使い続けやすい環境につながると考えています。
Do not assume everyone has the latest device. Avoid unnecessary processing. Keep only what is genuinely needed to communicate.
That is why this website is designed to be lightweight and simple.
最新の端末を前提にしないこと。不要な処理を増やさないこと。情報を届けるために、本当に必要なものだけを残すこと。
このサイトが軽量でシンプルに設計されているのには、そういった理由があります。
References
- International Energy Agency. Key Questions on Energy and AI.
- HTTP Archive. Web Almanac 2025: Page Weight.
- Sustainable Web Design. Estimating Digital Emissions.
- Mytton, Lundén & Malmodin. Network energy use not directly proportional to data volume. 2024.
- Arcep. Pour un numérique soutenable. 2026.
- Cordella et al. A life cycle analysis of smartphones. 2021.